Abstract
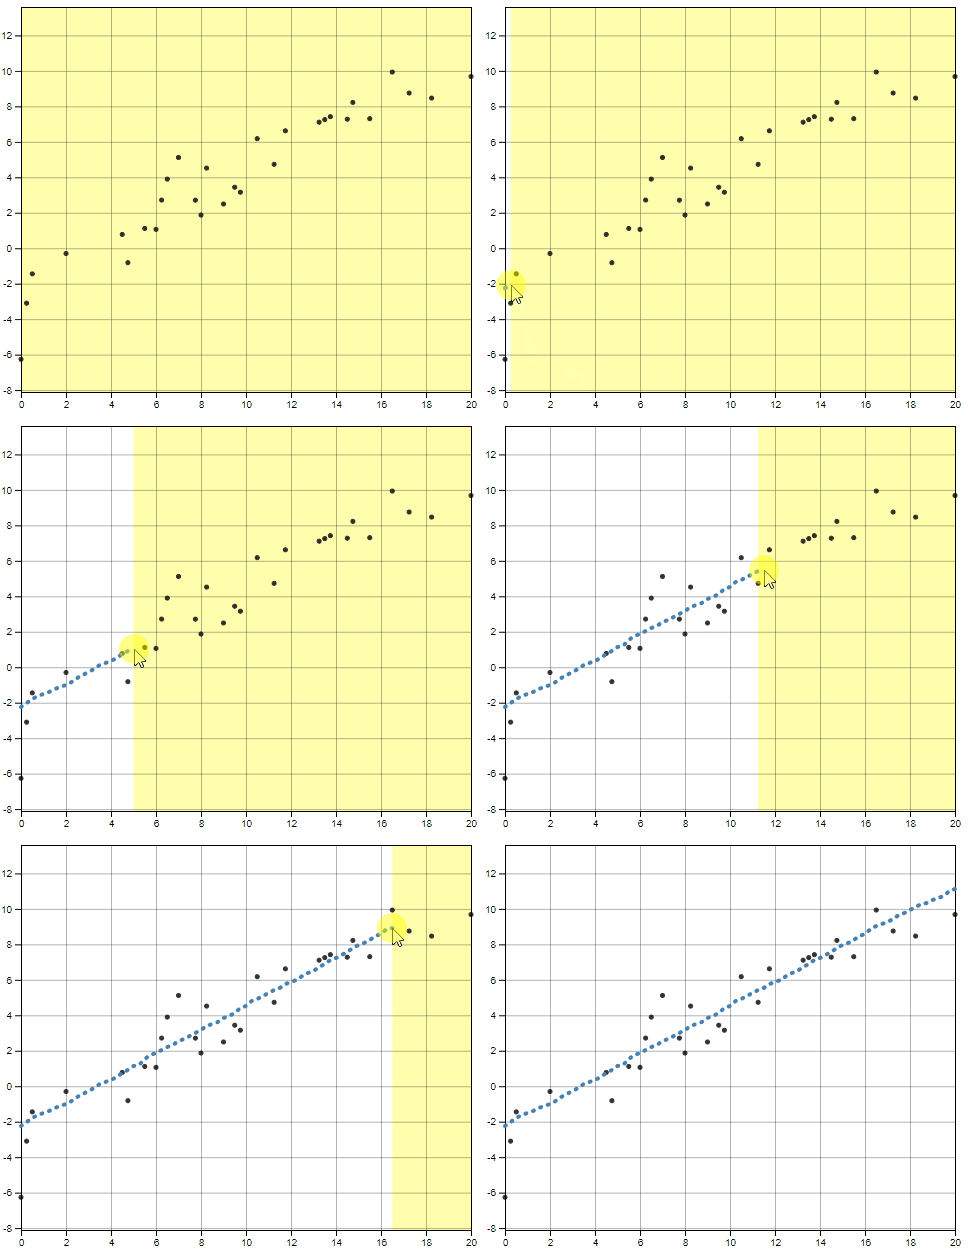
Fitting lines by eye through a set of points has been explored since the 20th century. Common methods of fitting trends by eye involve maneuvering a string, black thread, or ruler until the fit is suitable, then drawing the line through the set of points. In 2015, the New York Times introduced an interactive feature, called ‘You Draw It’. Readers are asked to input their own assumptions about various metrics and compare how these assumptions relate to reality. The New York Times team utilizes Data Driven Documents (D3) that allows readers to predict these metrics by drawing a line on their computer screen with their computer mouse. In my research, I established ‘You Draw It’ as a method for graphical testing by adapting the New York Times feature. I recruited participants via crowdsourcing websites and replicated the study found in Eye Fitting Straight Lines (Mosteller et al., 1981). Participants were directed to an RShiny application link and shown points following a linear trend and asked to draw a line through the data points using their computer mouse; task plots were generated using the r2d3 package in R statistical software. A linear mixed model and a generalized additive mixed model were used to determine the relationship between the participants drawn points and the best fit lines. Results from my study were consistent with those found in the previous study; when shown points following a linear trend, participants tended to fit the slope of the first principal component over the slope of the least-squares regression line. This trend was most prominent when shown data simulated with larger variances. The reproducibility of these results serves as evidence of the reliability of the you draw it method. Future work is necessary to implement the ‘You Draw It’ tool as a method of testing graphics.