Human perception of exponentially increasing data displayed on a log scale evaluated through experimental graphics tasks

Abstract
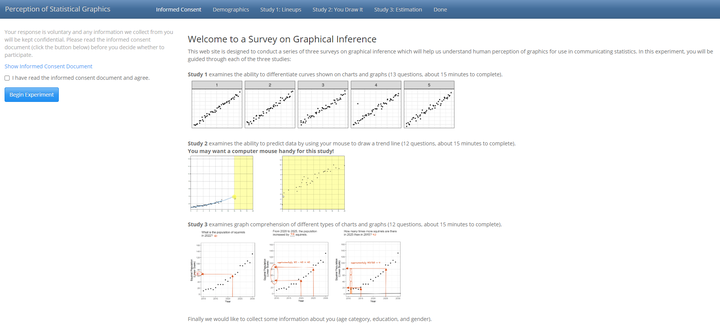
The series of graphical tests can be completed here.
Log scales are often used to display data over several orders of magnitude within one graph. We conducted a series of three graphical studies to evaluate the impact displaying data on the log scale has on human perception of exponentially increasing trends compared to displaying data on the linear scale. Each study was related to a different graphical task, each requiring a different level of interaction and cognitive use of the data being presented. The first experiment evaluated whether our ability to perceptually notice differences in exponentially increasing trends is impacted by the choice of scale. Participants were shown a set of plots and asked to identify which plot appeared to differ most from the other plots. Results indicated the choice of scale changes the contextual appearance of the data leading to slight perceptual advantages for both scales depending on the curvatures of the trend lines being compared. The second study validated a new method, ‘You Draw It’, for testing statistical graphics and introduced an appropriate statistical analysis method for comparing visually fitted trend lines to statistical regression results. This new method was then used to test participant’s ability to make forecast predictions for exponentially increasing trends on both scales. The results from the analysis showed a clear underestimation of forecasting trends with high exponential growth rates when participants were asked to make predictions on the linear scale; improvement in forecasts were made when participants were asked to make predictions on the log scale. The third study evaluated graph comprehension as it relates to the contextual scenario of the data shown. Overall, our results suggested that log logic is difficult and that anchoring and rounding biases result in a sacrifice in accuracy in estimates made on the log scale for large magnitudes. The studies conducted in this research relied on graphical tasks of varying complexity to help us understand the perceptual and cognitive advantages and disadvantages of displaying exponentially increasing data on the log scale. The results are instrumental in establishing guidelines for making design choices about scale which result in data visualizations effective at communicating the intended results.